|
|
| Project Overview:
Ice sheets play an important role in Earth’s climate system and water budget. Ice sheets influence and respond to changes in climate by modification of atmospheric circulation and through albedo dynamics. Sea level is modulated in part by the storage and release of water from ice sheets. The most recent report from the Intergovernmental Panel on Climate Change (IPCC; Church et al., 2001) shows that globally averaged atmospheric temperatures on Earth are increasing and in response, sea level is rising at a rate of 1 to 2 mm/year. This is due primarily to expansion of sea water, which may account for half of the current rate of sea level rise, and melting of glaciers, ice caps, and ice sheets, whose contributions are still inadequately understood (Church et al., 2001). The response of an ice sheet to climate changes and its contribution to the current rate of global sea level rise can be assessed by determining whether the ice sheet is gaining or losing mass.
Determining the mass balance of an ice sheet should be quite simple; subtract the mass lost (e.g. ablation, melting and ice berg calving) from the mass gained (i.e. new snow accumulation). However, measuring these variables has proven to be a monumental task; partly because Antarctica is so remote, and partly because we haven’t developed appropriate techniques. In this study, we focus on improving snow accumulation estimates in Antarctica using a popular new approach that involves geophysical and geochemical analysis of polar firn. The results of this ongoing study will lead to a much improved map of snow accumulation rates in Antarctica (by 2006), which will help us determine if this ice sheet is gaining or losing mass.
Abstract:
Isochronal layers in firn detected with ground-penetrating radar (GPR) and dated using results from ice core analyses are used to calculate accumulation rates along a 100-km across-flow profile in West Antarctica (Figs. 1 and 2). Accumulation rates are shown to be highly variable over short distances. (Fig. 3) Elevation measurements from global positioning system surveys show that accumulation rates derived from shallow horizons correlate well with surface undulations, which infers that wind redistribution of snow is the leading cause of this variability. Temporal changes in accumulation rate over 25- to 185-year intervals are smoothed to along-track length-scales comparable to surface undulations in order to identify trends in accumulation that are likely related to changes in climate. Results show that accumulation rates along this profile have decreased in recent decades, which is consistent with core-derived time series of annual accumulation rates measured at the two ends of the radar profile. These results suggest that temporal variability observed in accumulation rate records from ice cores and GPR profiles can be obscured by spatial influences, although it is possible to resolve temporal signals if the effects of local topography and ice flow are quantified and removed.
Download Data
- Download this dataset as an excel spreadsheet
See Table 1 for format details
[ Download Data ]
Table 1: Spreadsheet format
Column |
Title |
Description |
1 |
Trace |
Scan # after stacking |
2 |
Time |
GPS time of week in seconds |
3 |
Longitude |
Decimal degrees |
4 |
Latitude |
Decimal degrees |
5 |
X |
Polar stereographic coordinates in km |
6 |
Y |
Polar stereographic coordinates in km |
7 |
Elevation |
WGS84 ellipsoidal elevations in m |
8 |
Distance |
Along-track distance in km |
9 |
1966-2000 |
Accumulation rate (m/a) from 1966-2000 |
10 |
1941-2000 |
Accumulation rate (m/a) from 1941-2000 |
11 |
1893-2000 |
Accumulation rate (m/a) from 1893-2000 |
12 |
1848-2000 |
Accumulation rate (m/a) from 1848-2000 |
13 |
1815-2000 |
Accumulation rate (m/a) from 1815-2000 |
14 |
1941-1966 |
Accumulation rate (m/a) from 1941-1966 |
15 |
1893-1941 |
Accumulation rate (m/a) from 1893-1941 |
16 |
1848-1893 |
Accumulation rate (m/a) from 1848-1893 |
17 |
1815-1848 |
Accumulation rate (m/a) from 1815-1848 |
|
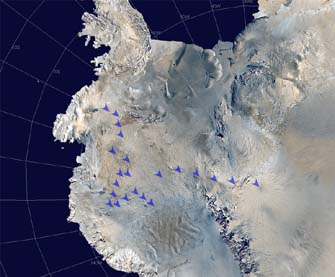
Click image to enlarge Fig. 1: Map of Antarctica showing the locations where US-ITASE ice cores were collected. The solid red line represents the radar profile collected between sites 00-4 and 00-5 (Fig. 2).
Click image to enlarge
Fig. 2: Radar data collected between US ITASE sites 00-4 and 00-5. a) 400-MHz pulse shape as reflected by a high-density layer in firn (black line). The pulse was deconvolved with a spiking routine (blue line) before performing the Hilbert magnitude transform (red line). b) Radar profile after deconvolution and Hilbert magnitude transformation. The darkened horizons are tracked (black lines) to illustrate isochronal continuity between core sites. The deepest visible horizon at site 00-4 has been tracked the entire distance (~550 km along-track) to Byrd Station. Signal fading related to surface undulations is apparent beyond 60 km. Figure taken from Spikes and others (2004).
Click image to enlarge
Fig. 3: Spatial variability in accumulation rates from ice cores and GPR profiling. Left: Annual accumulation rates for cores 00-4 (orange) and 00-5 (gray). Top right: Surface topography. Center right: Calculated accumulation rates for each digitized horizon shown in Figure 2 (see legend). The sloping black line (short dashes) is the linear fit through the long-term accumulation rate based on the 1815 horizon. The core- (dashed orange line) and radar-derived (dashed black line) means are also shown. Bottom right: Gradients along the elevation profile (black line) (top right) and the 1966-2000 accumulation rate profile (blue line) (center right). Figure taken from Spikes and others (2004).
Data Collected during the 2000-2001 US ITASE Traverse
Support for this project provided by:
- National Science Foundation
- National Aeronautics and Space Administration
- University of Maine Climate Change Institute
- USA Cold Regions Research and Engineering Lab
|
Primary Citation:
V.B. Spikes, G.S. Hamilton, S.A. Arcone, S. Kaspari, and P. Mayewski. 2004. Variability in Accumulation Rates from GPR Profiling on the West Antarctic Plateau. Annals of Glaciology, 39, 238-244.
[ Download PDF ]
Related Publications:
- S. A. Arcone, V.B. Spikes, G.S. Hamilton and P.A. Mayewski. 2004. Stratigraphic continuity in 400-MHz short-pulse radar profiles of firn in West Antarctica. Annals of Glaciology, 39, 195-200.
- S. A. Arcone, V.B. Spikes, G.S. Hamilton. 2005. Phase structure of radar stratigraphic horizons within Antarctic firn. Annals of Glaciology, 41, 10-16.
- S. A. Arcone, V.B. Spikes, G.S. Hamilton. 2005. Stratigraphic variation within polar firn caused by differential accumulation and ice flow: interpretation of a 400-MHz short-pulse radar profile from West Antarctica. Journal of Glaciology, 51(174), 407-422.
- D.A. Dixon, P.A. Mayewski, S. Kaspari, S. Sneed and M. Handley. 2004. 200-year sub-annual record of sulfate in West Antarctica, from 16 ice cores. Annals of Glaciology, 39, 545-556.
- S. Kaspari, P.A. Mayewski, D.A. Dixon, V.B. Spikes, S.B. Sneed, M.J. Handley and G.S. Hamilton. 2004. Climate variability in West Antarctica derived from annual accumulation rate records from ITASE firn/ice cores. Annals of Glaciology, 39, 585-594.
|